HowTo/Understand Level of Detail in Trainz
Tonyhilliam (Talk | contribs) (Created page with "This page sets out to explain in layman's terms why Level of Detail (LOD) is the most important tool a content creator has to make their assets both look good and perform well...") |
Revision as of 16:26, 20 March 2014
This page sets out to explain in layman's terms why Level of Detail (LOD) is the most important tool a content creator has to make their assets both look good and perform well in-game.
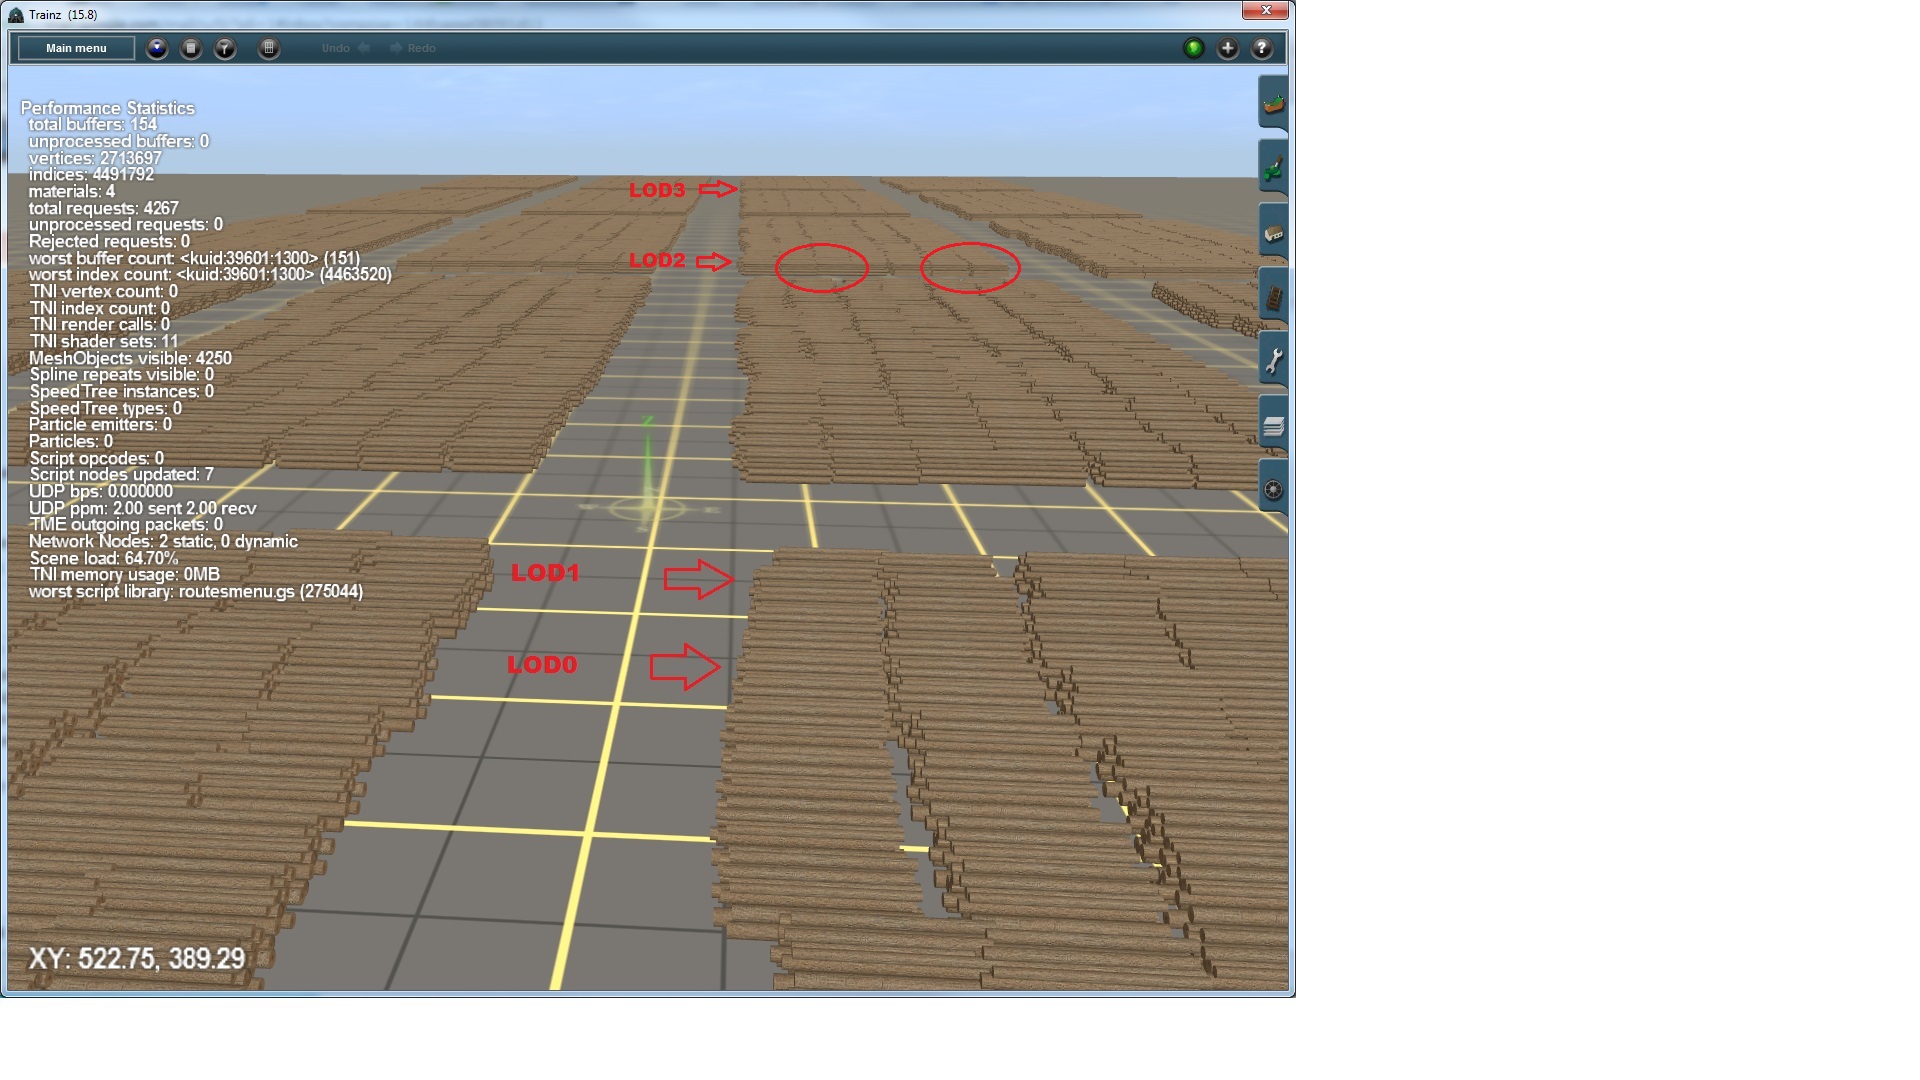
We'll start by taking a look at 10 million logs using 4 x LODS in the following image. The logs are built in stacks of 20 logs (i.e. one object = 20 logs) and have been placed in groups of 250 objects per area (so that is 20 x groups of 500,000 logs in total).
We've turned our performance monitoring tools on to record what is happening on screen, and we've added some labels to explain what you are seeing. Let's go through things one by one:
The stats show that we are looking at 4250 of the piles of logs (8.5M logs in total) and there are 4.5M vertices on screen (roughly speaking, 3 vertices per triangle).
The arrows point to the point where the LOD changes. The first change is there, it's just almost impossible to see that the LOD1 arrow is pointing to a 550 poly object and not an 880 poly object.
The LOD 2 change has been highlighted by the two circles. You can just make out the different shading on the "round" logs versus the square logs used in LOD2.
At the back, it is so far away that in this case, again there is no visible difference when the lod changes.
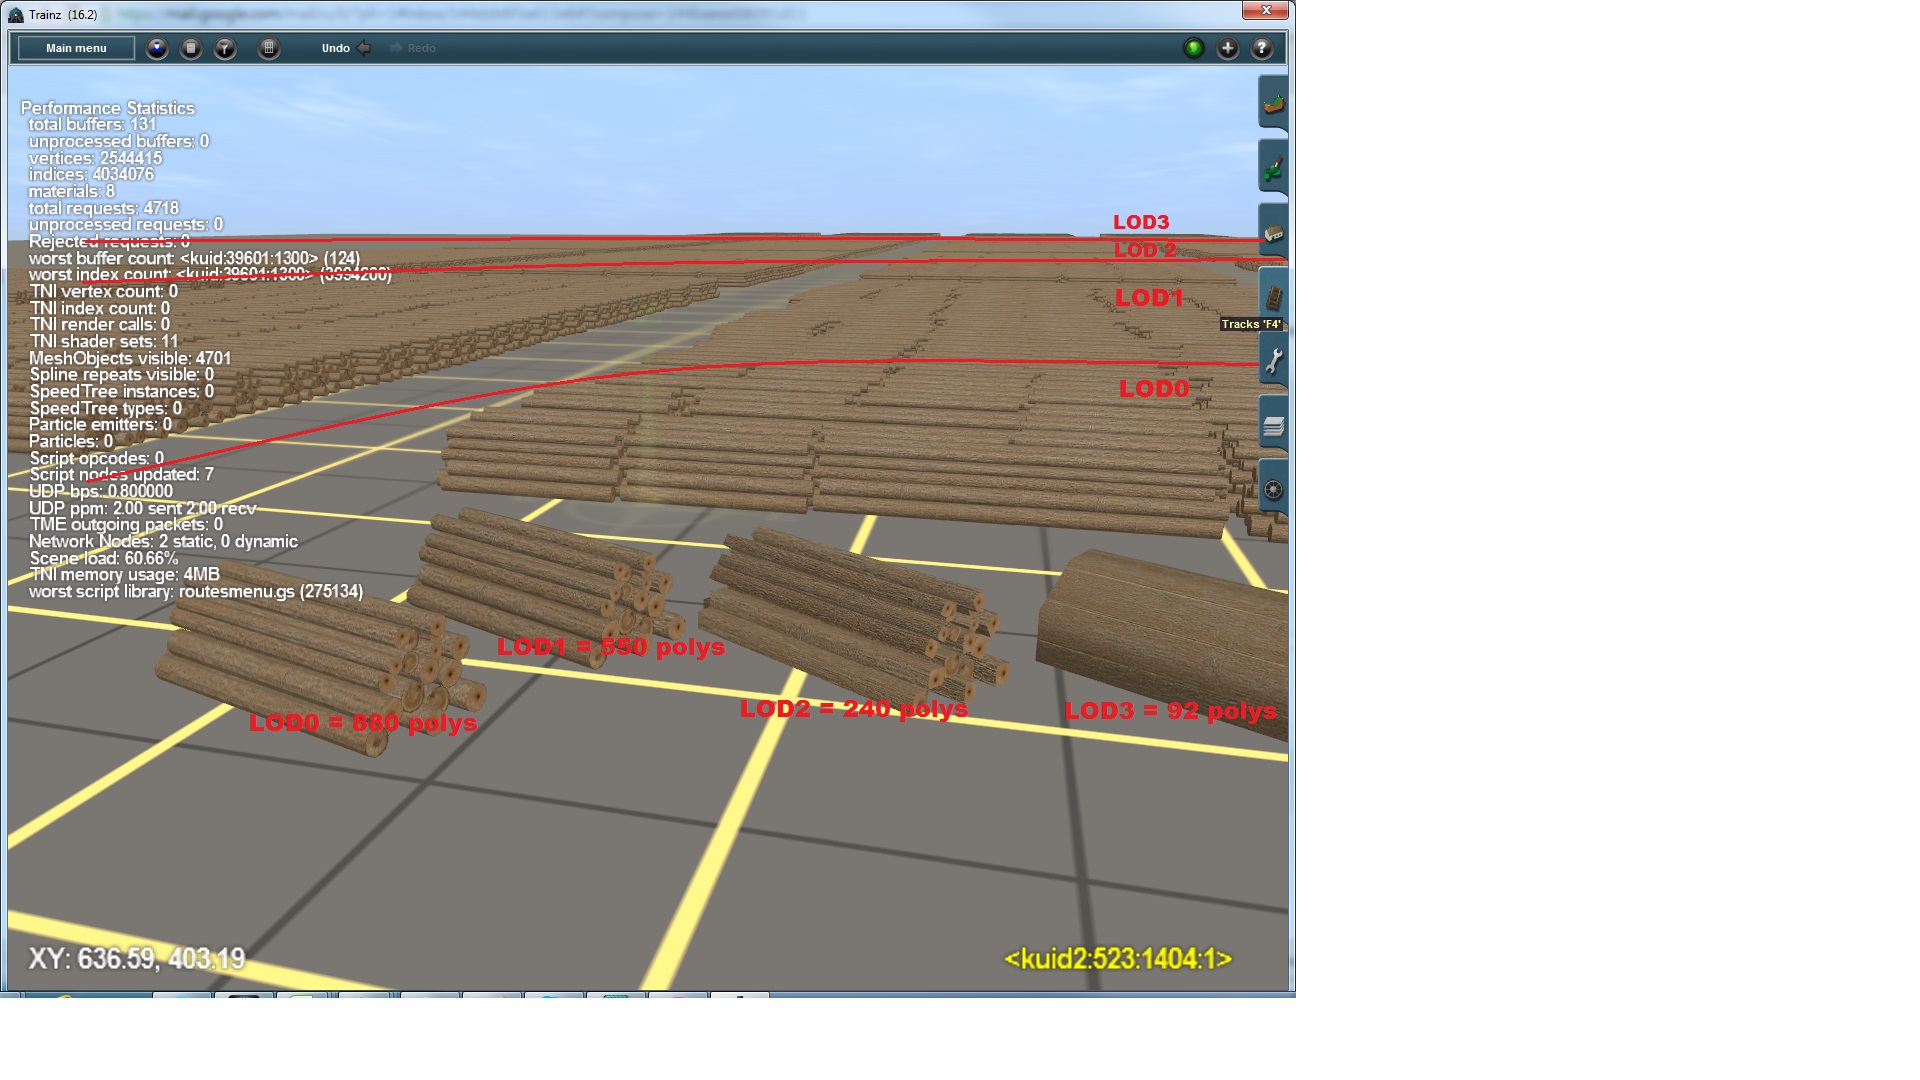
This time we have placed at the front (near camera) the four different LOD objects that range from 880 polys (triangles in Trainz) in LOD0 down to just 92 polys in LOD4. To show these items this close to camera, we exported them as individual items. Even at just over 10m camera distance, it is difficult to differentiate between LOD0 and LOD1. You may be able to notice that the logs have reduced from 12 sided objects to 8 sided.
The bigger step is to LOD2 where our logs become square objects, and then the final step is to replace all that geometry with a few textures planes.
In the background are all our logs. The lines indicate the approximate point where the LOD changes to the next lowest level of detail. The first change is imperceptible. Lod1 > Lod2 is only noticeable due to a very slight colour change, and from this low camera view, LOD3 is hardly visible at all (which further illustrates the importance not to waste polygons out in the far reaches away from the camera.
Next we'll look at why this technique works, and it is all to do with the way the camera views the scene.
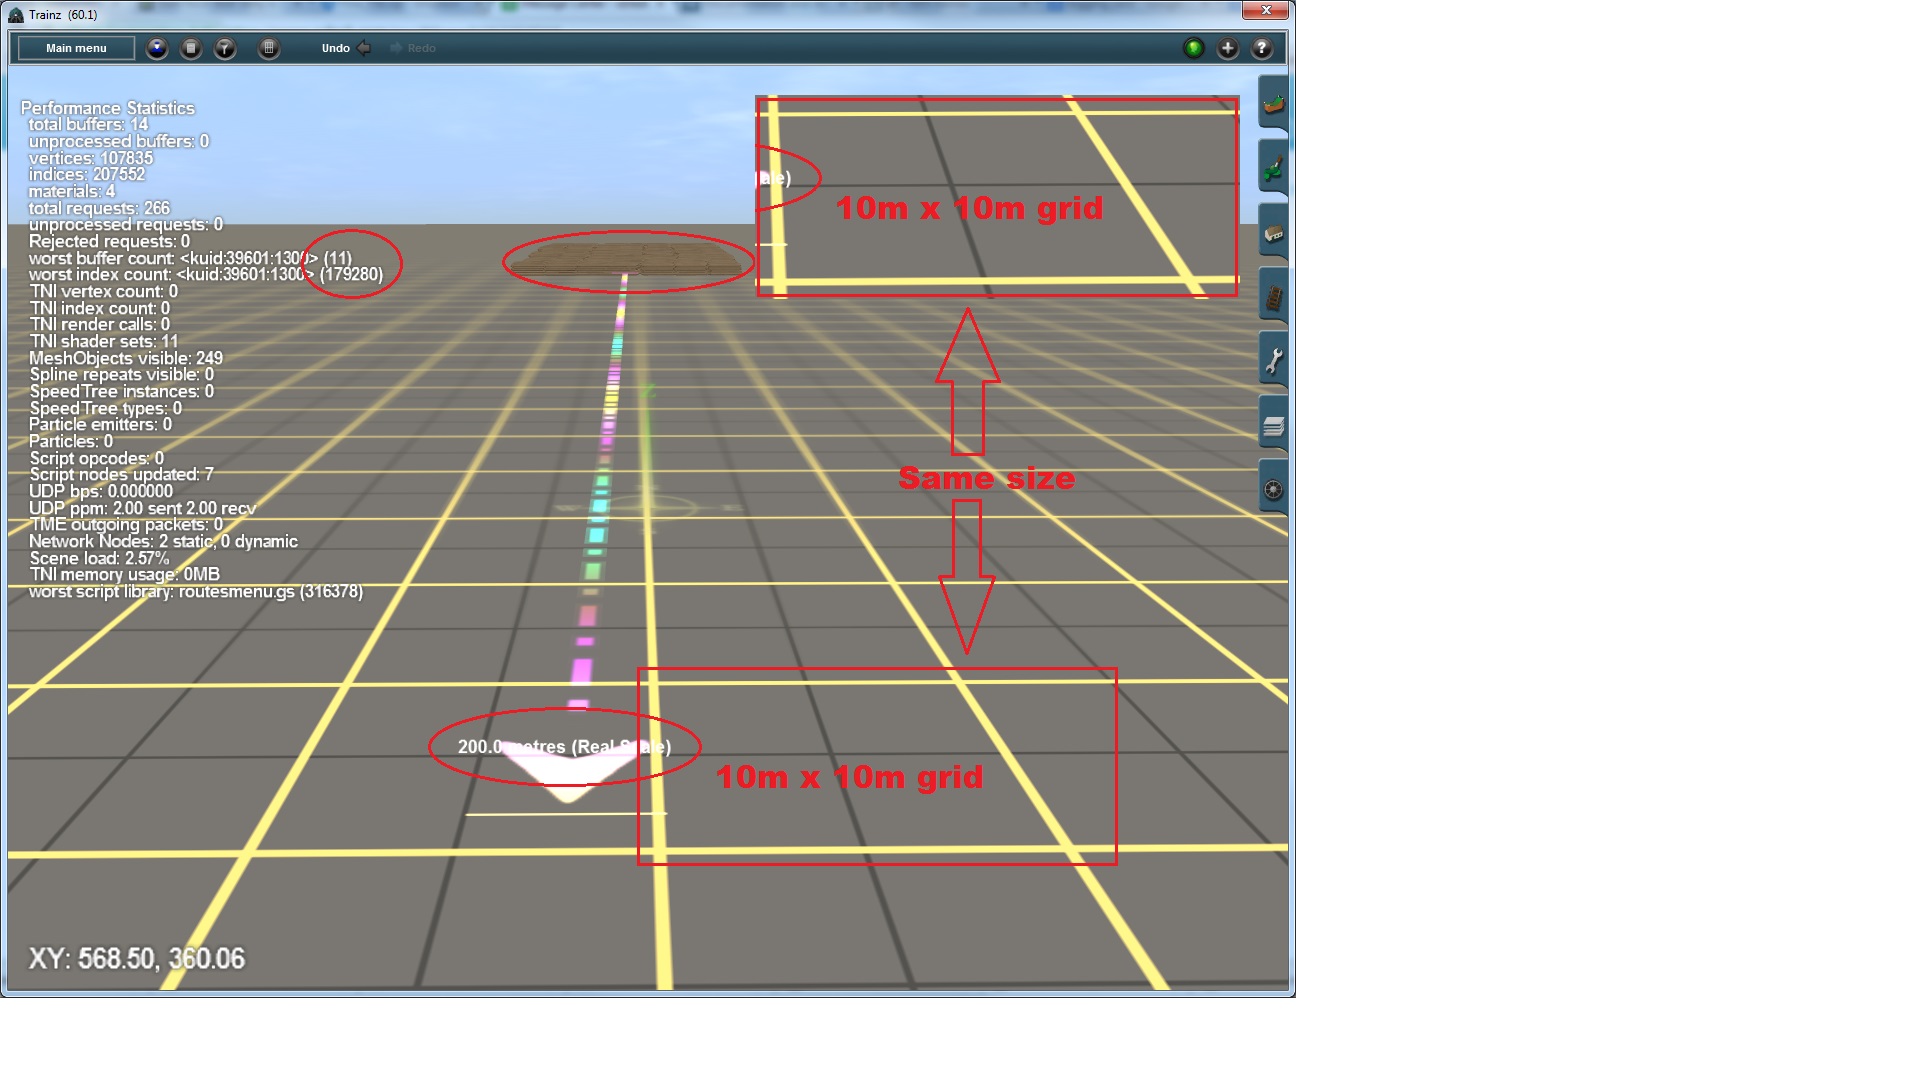
Here we see a single area of 500,000 logs that are situated 200 meters away from the camera. The logs themselves take up a land area of roughly 50m x 150m = 7,500m2. We have then copied the 10m x 10m grid from close to the camera, and pasted it back by the logs. You can see that the logs would actually fit in a single 5m x 5m grid or 25m2.
We have compressed 7,500m2 of objects into just 25m2, but what is important for the computer is not land area, but rather pixels on screen. Let's do the maths:
Across the screen at the bottom, there are 1280 pixels and roughly 5 x 5m grids or 25m across (a pixel is the smallest dot of colour on your screen). Therefore a 1m long object that is 1 pixel high would be 50 pixels in width. A 1m x 1m image would take about 2,500 pixels to render (50 x 50 pixels).
Next, at 200m distance, our logs which spread almost 50 meters across, are actually taking up less than a fifth of the screen width. So now our 1m long object is just 5 pixels wide! (i.e. 50m represents 1/5th of our screen width = 1280 pixels/5 = 250 pixels).
So just 200m distance reduces from 50 pixels per meter object to just 5 pixels.


